Mastering Cryptocurrency Market Movements: Heatmap Analysis Guide
Discover how to master cryptocurrency market movements with expert heatmap analysis. Learn trends, volatility signals, and trading insights in this complete guide.
cryptocurrency market movements has become one of the most essential skills for modern traders and investors. The crypto market is fast, volatile, and unpredictable, making it extremely important to use tools that simplify data and reveal hidden patterns.One of the most powerful tools available today is the crypto heatmap, a visual representation of price action, market strength, volume flow, and investor sentiment across digital assets. It shows what the market is doing in real time, letting users react quickly and confidently.
This article provides a complete guide to mastering cryptocurrency market movements using heatmap analysis.Each section breaks down important topics into simple explanations, helping beginners and advanced traders understand how to read the market like professionals.
Cryptocurrency Market Movements
Cryptocurrency market movements refer to the rise and fall of digital asset prices within a specific period. These movements are influenced by several factors, including market demand, investor sentiment, global events, technology updates, and liquidity conditions.
The market never stays static.It constantly shifts due to heavy trading activity, making it important for investors to recognize patterns in price behavior before taking action.By studying these patterns, traders can understand whether digital assets are experiencing momentum, correction, or consolidation.This understanding helps traders predict future outcomes and make informed decisions based on reliable data rather than emotions.
Why Heatmap Analysis Matters in Cryptocurrency Trading
A crypto heatmap is a graphical tool that displays the performance of major coins and tokens in a colorful, easy-to-read format.Each asset is represented by a small box, where color and size indicate market performance.Heatmaps help traders identify trends instantly.While traditional charts require deep analysis, heatmaps show winners and losers at a glance, offering a clearer overview of market dynamics.
This type of visual analysis is essential for mastering cryptocurrency market movements because it condenses thousands of data points into a simplified format.It allows traders to understand the market’s emotional temperature—whether there is fear, greed, or neutrality dominating price action.
How Heatmaps Help Track Cryptocurrency Market Movements
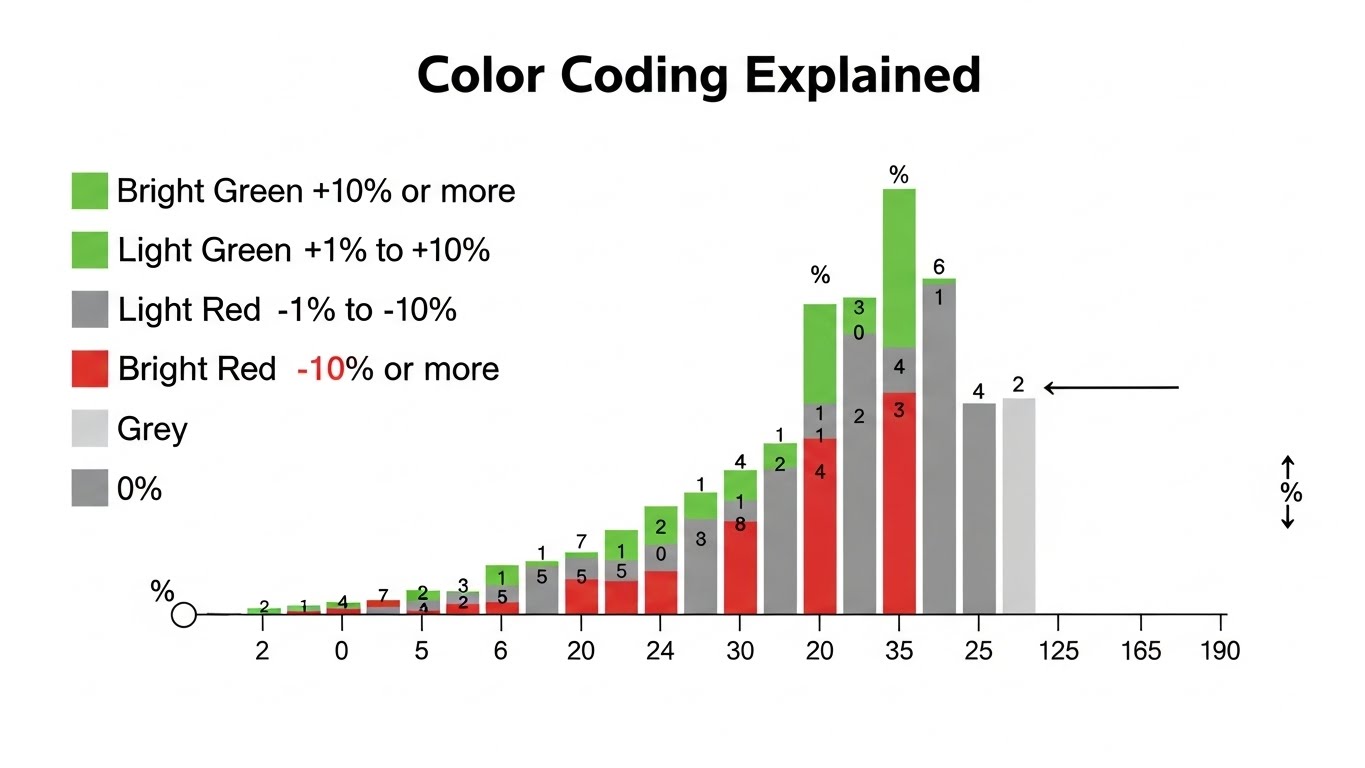
Heatmaps reveal price changes using colors—typically green for upward movement and red for downward movement.The intensity of each color indicates the strength of the movement, which helps traders assess volatility.Heatmaps also categorize assets based on market capitalization.
This allows traders to identify whether Bitcoin, Ethereum, or altcoins are driving broader market trends.
When used properly, a heatmap becomes a powerful indicator of cryptocurrency market movements, guiding traders toward better strategies.It highlights hidden opportunities, exposes potential risks, and provides a real-time view of market activity.
Identifying Bullish and Bearish Trends Using Heatmaps
When most boxes in a heatmap turn bright green, it signals a bullish market phase.This shows widespread buying interest and growing investor confidence.On the other hand, when the heatmap turns red, bearish pressure dominates.This indicates selling volume and weakening market sentiment across major crypto assets.
Heatmaps are valuable because they capture the emotional shift of the entire crypto ecosystem.
Without reading deep charts, users can instantly understand whether the market is trending up, down, or sideways.These colors display the continuous rhythm of cryptocurrency market movements, making heatmaps essential for real-time analysis.
Spotting Market Leaders and Laggards
Heatmaps display each crypto asset in proportion to its market capitalization.This makes it easy to identify which coins dominate market movements.For example, if Bitcoin shows strong green while altcoins remain flat or red, it signals BTC dominance.
This means Bitcoin is driving the broader trend while altcoins lag behind. these leaders and laggards gives traders clarity on which assets influence the market the most.This is a crucial step in reading cryptocurrency market movements and predicting upcoming shifts.
The Role of Volume Heatmaps in Market Analysis
Volume heatmaps display how much trading activity each asset experiences during a specific time.High volume indicates heavy interest, which often causes strong price movements.Low volume signals low activity, making price action unreliable.Without adequate volume, market movements may be weak or easily manipulated.
Using a volume heatmap helps traders confirm whether market direction is genuine or artificial.
This improves decision-making through accurate data validation.Volume heatmaps are especially valuable during market reversals.Sudden spikes in red or green volume may warn traders of potential breakouts or breakdowns.
Heatmaps and Market Sentiment in Cryptocurrency Trading
Heatmaps are not just technical tools—they represent the emotional state of the market.Colors reveal whether investors are fearful, neutral, or confident.Fear tends to push prices downward, causing heatmaps to turn red.
Greed pushes prices upward, generating strong green color patterns.
Understanding market sentiment is essential for mastering cryptocurrency market movements.
Even fundamental news and global events affect heatmap colors instantly.These reactions display the psychological behavior of millions of traders worldwide.Heatmap sentiment tracking thus becomes essential for recognizing trend strength and direction.
Bitcoin Dominance and Its Impact on Heatmap Analysis
Bitcoin accounts for a significant portion of total crypto market capitalization.Its movements greatly influence altcoins and overall market direction.When Bitcoin rises strongly, heatmaps show massive green blocks under BTC.This often pulls major altcoins upward, triggering bullish patterns across the board.However, when Bitcoin drops sharply, heatmaps quickly shift to red.This usually results in widespread panic selling, dragging the entire crypto market down.Bitcoin dominance allows traders to predict the next wave of cryptocurrency market movements.It also helps traders avoid buying altcoins during unstable BTC cycles.
Watching Ethereum’s Influence on Market Movements
Though Bitcoin leads the market, Ethereum also plays a major role.Its price signals often affect DeFi, NFT tokens, and Web3-focused cryptocurrencies.If Ethereum grows faster than Bitcoin, heatmaps may show stronger green in the altcoin sector.This signals increased risk-taking from investors, hinting at a potential altcoin season.Ethereum’s dominance is crucial for understanding the balance of power in crypto.Heatmaps make it easier to see how ETH impacts broader market direction.
Using Heatmaps to Identify Market Opportunities
One of the biggest advantages of using heatmaps is opportunity detection.Heatmaps quickly show undervalued or overperforming coins.For example, if most coins are red but one token is bright green, it may indicate strong demand or a fundamental catalyst.
This could present a profitable opportunity for traders.Heatmaps display market momentum in real time.They help users quickly identify breakout coins, sector strength, and fresh market trends.This efficient detection system makes heatmaps an essential tool for mastering cryptocurrency market movements.It transforms complex analysis into easy-to-understand visuals.
Sector-Based Heatmap Analysis in Crypto
Sector heatmaps organize assets into categories such as Layer-1, Layer-2, DeFi, AI tokens, and gaming tokens.
This organization helps traders understand which sectors are dominating the market.For instance, if the AI sector heats up with strong green colors, traders may expect short-term momentum in AI-focused assets.Sector heatmaps make it easier to track which industries are trending.This level of detail enhances the study of cryptocurrency market movements because it shows the market’s sector rotation behavior.Just like traditional stock markets, crypto also experiences rotating cycles of growth and decline across sectors.
Comparing Strong and Weak Sectors
Sector analysis helps traders compare performance between different crypto categories.
A sector showing continuous green indicates sustained interest.Meanwhile, consistent red coloring in a sector indicates weakness and potential risk.
This comparison guides traders toward safer and more profitable opportunities.Heatmaps make these observations extremely simple.Instead of reading charts for every token, users see sector strength instantly.
How Institutional Traders Use Heatmap Analysis
Institutional traders rely heavily on heatmaps to manage multimillion-dollar portfolios.Heatmaps offer a quick method for identifying market trends and adjusting positions.Institutions use heatmaps to study liquidity, volatility, and strong price zones.
This helps them reduce risks by reacting before the general public does.These traders use advanced tools to understand deeper cryptocurrency market movements.They rely on heatmaps for predicting large market rotations and major trend shifts.
Smart Money Flow Through Heatmaps
Heatmaps often reveal smart money behavior.When large investors enter or exit a market, heatmap colors shift accordingly.A sudden rise in strong green across large-cap coins may indicate institutional accumulation.
Meanwhile, extended red patterns suggest institutional selling pressure.This knowledge helps retail traders follow the right direction.It reduces emotional mistakes and improves decision-making accuracy.
Building a Trading Strategy Using Heatmap Analysis
A strong trading strategy requires understanding trend direction.Heatmaps identify whether a trend is growing, weakening, or reversing.By combining heatmaps with technical indicators such as RSI, MACD, or moving averages, traders gain an edge.This mixed approach confirms entries and exits more accurately.
Heatmaps also help identify consolidation zones.When colors remain unchanged for long periods, the market may be preparing for a big movement.Understanding these patterns is essential for mastering cryptocurrency market movements and trading profitably.It provides clarity in both volatile and calm markets.
Short-Term vs. Long-Term Heatmap Strategies
Short-term traders use heatmaps to capture quick market swings.
They rely on real-time color changes to predict price action.Long-term investors focus on broader trends displayed over days or weeks.Heatmaps help them visualize macro-level growth or decline in crypto assets.Both strategies depend on consistent observation.Mastering heatmap behavior leads to more confident and profitable trading.
Limitations of Heatmap Analysis in Crypto Trading
Heatmaps are effective but not perfect.They primarily show data visually and do not explain why price movements occur.Market news, regulations, and whale activity still require external analysis.Heatmaps must be paired with other tools for complete understanding.Overreliance on heatmaps may also mislead beginners.
Not every colored change represents a real opportunity.Therefore, traders must treat heatmaps as supportive tools, not the only strategy.This balanced approach helps users benefit from heatmaps without falling into traps.
Conclusion
Mastering cryptocurrency market movements requires patterns, sentiment, and real-time market behavior.Heatmaps provide one of the most powerful and user-friendly tools for accomplishing this.They help traders visualize market trends instantly, identify winners and losers, understand sector strength, and predict potential opportunities.
From Bitcoin dominance to smart money flows, heatmaps simplify complex data into clear visual guidance.Using heatmaps effectively allows both beginners and professionals to make informed decisions.
When combined with technical and fundamental analysis, heatmaps become an unstoppable tool for profitable crypto trading.
(FAQs)
Q: What is a cryptocurrency heatmap and how does it actually help traders understand real-time market movements more accurately?
A cryptocurrency heatmap is a visual tool that displays market data such as price changes, volume, and overall sentiment in color-coded form, allowing traders to instantly see which assets are performing strongly and which are declining. Instead of analyzing long charts, a heatmap makes market behavior easier to understand by highlighting real-time movements with simple visual signals. This helps traders quickly assess momentum and identify potential opportunities without going through complex indicators. As a result, heatmaps have become one of the most useful tools for both beginners and advanced traders who want fast insights into the market.
Q: How can beginners use heatmap analysis effectively to identify profitable trends before entering the crypto market?
Beginners can use heatmap analysis to spot profitable trends by focusing on color intensity, sudden shifts, and clusters of coins moving in the same direction. These visual patterns reveal whether buyers or sellers are dominating the market at a given moment. By monitoring these signals, new traders can understand which cryptocurrencies show strong momentum and which are weakening. Heatmaps also simplify trend identification by minimizing technical complexity, making it easier for beginners to enter the market with more confidence and reduced risk.
Q: Why is mastering cryptocurrency market movement analysis essential for long-term success, and how does understanding heatmap signals improve trading decisions?
Mastering market movement analysis is essential because it helps traders understand not only price behavior but also the underlying strength of trends, investor sentiment, and potential market turning points. Heatmap signals play a major role here by offering a clear visual picture of real-time market activity, enabling traders to make better decisions about when to enter, exit, or avoid certain trades. This understanding reduces emotional trading and improves timing, allowing long-term traders to build consistent strategies and avoid common mistakes caused by market noise. With proper heatmap analysis, traders enhance their ability to predict market shifts and protect their portfolios.
Q: What key factors influence price changes displayed on a cryptocurrency heatmap during high volatility, and how should traders interpret these rapid shifts?
During high volatility, price changes shown on a heatmap are influenced by factors such as sudden news events, large buy or sell orders, market sentiment, liquidity levels, and global economic developments. These quick shifts appear as rapid color changes on the heatmap, alerting traders to potential breakouts or corrections. To interpret these movements, traders should look for repeated patterns or large clusters of coins reacting similarly, as this often signals market-wide behavior rather than isolated events. Understanding these rapid changes helps traders make informed decisions and avoid impulsive entries during unstable market conditions.
Q: How does heatmap data compare with traditional technical tools such as candlestick charts and indicators in real-time crypto analysis?
Heatmap data offers faster and more intuitive insights compared to traditional tools like candlestick charts and technical indicators, which require deeper interpretation. While charts and indicators provide detailed analytical information, they can be slow for traders needing real-time responses. Heatmaps, on the other hand, summarize market strength, sentiment, and price action visually, allowing traders to react quickly to opportunities. Many traders use heatmaps alongside conventional methods to combine speed with accuracy, creating a well-balanced approach to crypto analysis. This makes heatmaps a powerful companion tool for real-time decision-making.